Java Command-Line Debugging with AI Agent
When you need to track down a complex bug, your first instinct is to reach for a visual debugger. You set a breakpoint, step through the logic, and inspect the stack trace. But in an era of agentic coding, IDEs and visual debuggers are a bottleneck.
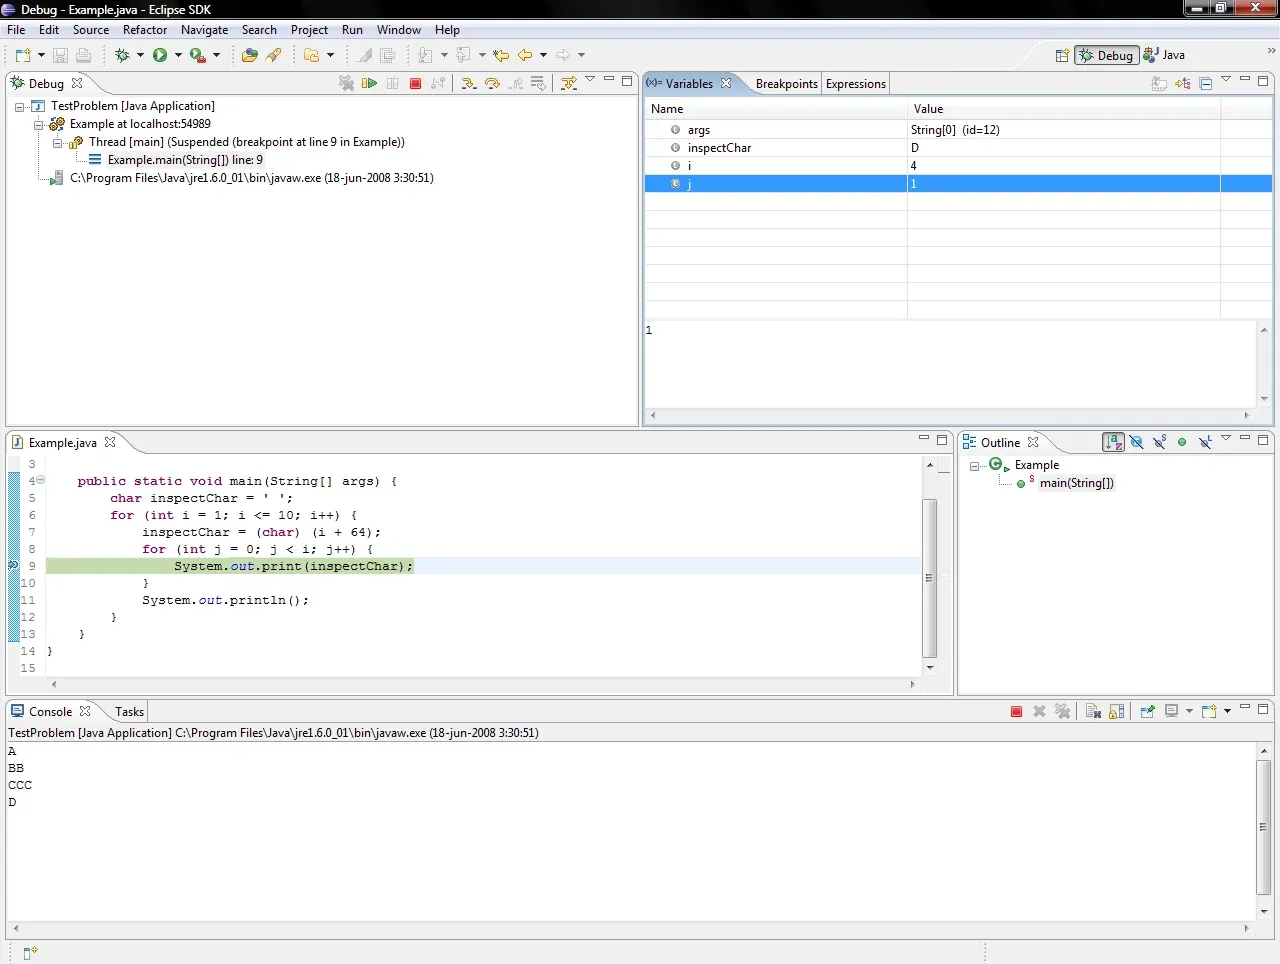
IDEs and their visual debuggers in the agentic coding era are not an option anymore 🙅 Eclipse suspended at breakpoint
The best next option is adding some logs as breadcrumbs to try to understand what is happening
void processPayment() {
    System.out.println("Entering processPayment()");
    // ...
    if (isValid) {
        System.out.println("Processing valid payment: " + paymentId);
    }
}
It is a natural approach, but the feedback loop is slow in Java. Each change means compiling, packaging, and running again, or at best, a hot-reload. You make many code modifications just to understand what happens, but those print statements only work in your own code.
I need something my agent can use, the same way I use a visual debugger.
JDB: The built-in command-line debugger for Java
I gave jdb a try, the command-line debugger that was always there (since jdk 1).
You can connect to a jvm that is running with the debugger options:
java -agentlib:jdwp=transport=dt_socket,server=y,suspend=n,address=*:5005 MyClassThen you can connect using that port:
jdb -attach 5005This is an interactive tool where you send commands like:
- add breakpoints:
stop at com.saburto.Bar:46or by methodstop at com.saburto.Bar.getAllLedgers - steps:
step,step up,stepi,next,cont - get variables info:
print,dump,eval,locals,set - threads:
where,threadgroups,up,down,kill,interrupt - show source code:
useto add the source code path,listto show the code
The source code looks clean in the output of the coding agent
  42    @GetMapping
  43    public PageResponse<LedgerResponse> getAllLedgers(
  44            @RequestParam(defaultValue = "0") int page, @RequestParam(defaultValue = "20") int size) {
  45
  46 =>     var ledgers = ledgerService.getAllLedgers(page, size);
  47
  48        var content =
  49                ledgers.getContent().stream().map(mapper::toLedgerResponse).toList();
  50
  51        return new PageResponse<>(content, page, size, ledgers.getTotalElements(), ledgers.getTotalPages());
Let your agent know the tools
Frontier models are intelligent enough to figure out how to call jdb, but if you want to lend a hand, create a skill using man jdb to document the key commands.
Scenarios
-
Dump a request payload
Attach jdb to my app at port 5005, set a breakpoint at
LedgerController.getAllLedgers, triggercurl localhost:8080/api/ledgers, and dump every field of theledgersPage object. I want to see the actual database records returned. -
Trace a variable’s mutations
Set a breakpoint in
PaymentService.process, step through line by line withnext, and dump thepaymentvariable after each line. I want to see how the status field changes as it moves through validation, enrichment, and persistence. -
Inspect concurrency at a checkpoint
Break at the top of my scheduled job in
ReconciliationScheduler.run, trigger a full thread dump withwhere all, and show me what every other thread is doing at that moment. Any thread blocked on a lock? -
Evaluate an expression in place
Set a breakpoint at line 89 of
InvoiceCalculator, and when it hits, runeval invoice.getLineItems().stream().mapToDouble(LineItem::getTotal).sum(). I want to verify the line-item math without adding a log line, rebuilding, and waiting for Maven. -
Debug exception state without re-deploying
Break inside the catch block of
PaymentGateway.submit(line 203), send a payment request with a bad card number, and when the breakpoint fires, dump the exception’s message, cause chain, and the local variables. I want to see exactly what the gateway rejected and what state the request was in.
These prompts share a common shape: pick a breakpoint, trigger the code path, and let the agent extract the data. The agent handles the timing, the jdb commands, and the output parsing, and you get the answer in your terminal.
Simple examples
Checking variables in a request
For a Java application, you need to start the system with the proper arguments: java -agentlib:jdwp=transport=dt_socket,server=y,suspend=n,address=*:5005 -jar app.jar
For spring-boot application using mvn:
mvn spring-boot:run -Dspring-boot.run.jvmArguments="-agentlib:jdwp=transport=dt_socket,server=y,suspend=y,address=*:5005"Then connect by attaching to the port: jdb -attach 5005, and that is it.
jdb is interactive by design, but in an agentic workflow the session must run hands-off, with the HTTP request firing while the debugger is attached and waiting.
Warning
This is only an example of how my agent generated the script to use the debugger. Depending on your case it may be different; let your agent create the right script.
Because the agent cannot type commands interactively into a debugger prompt, we pipeline the commands through standard input instead:
cd ~/projects/my-app && rm -f /tmp/jdb-output.txt && (
  echo "stop in com.saburto.ledger.controller.LedgerController.getAllLedgers"
  echo "cont"
  sleep 5
  echo "next"
  sleep 1
  echo "dump ledgers.content.elementData"
  echo "dump ledgers.content.elementData[0]"
  sleep 2
) | timeout 30 jdb -attach 5005 > /tmp/jdb-output.txt 2>&1 &
JDB_PID=$!
sleep 2
curl -s localhost:8080/api/v1/ledgers \
  -H "Authorization: Bearer $(./scripts/get-token.sh)" > /dev/null
wait $JDB_PID 2>/dev/null
echo "JDB_EXIT=$?"
Let’s break this down:
- The
( echo ... echo ... )subshell pipes a sequence ofjdbcommands into the debugger. Each command goes in at the right time: set the breakpoint, continue, wait 5 seconds for the HTTP request to arrive and hit the breakpoint, then step over the assignment and dump the ledger data. - The whole thing runs in the background (
&), with its PID captured. - After a 2-second head start,
curltriggers the REST endpoint that runsgetAllLedgers(). - The script then waits for jdb to finish and reports the exit code.
The agent reads /tmp/jdb-output.txt afterward.
The next command steps past the var ledgers = ... assignment before the dumps run. The sleep calls pace the commands so they arrive after the breakpoint fires. The agent reads the output file and reconstructs the data.
Now we see each LedgerEntity instance:
ledgers.content.elementData[0] = {
    id: instance of java.util.UUID(id=15654)
    name: "Basic Transactions Ledger"
    createdAt: instance of java.time.Instant(id=15670)
    isNew: false
}
Tip
Use
tmuxas the bridge between agent and debugger. Tell the agent to open a new panel or window in tmux and send all debugging commands there while keeping your coding agent open in the original pane. This is the pattern we use throughout this post, including the SQL extraction later, to keep the agent andjdbrunning in parallel.
Printing the Header of the Http Request
Here is an example. Without touching a single line of code, I asked the agent to show me the HTTP request headers hitting a controller method. After a few tries, it delivered exactly what I needed:
Request Headers at LedgerController.getAllLedgers() (line 46, bci=0)

 ┌───┬───────────────┬─────────────────────────────────────────────────────────────┐
 │ # │ Header        │ Value                                                       │
 ├───┼───────────────┼─────────────────────────────────────────────────────────────┤
 │ 0 │ Host          │ localhost:8080                                              │
 ├───┼───────────────┼─────────────────────────────────────────────────────────────┤
 │ 1 │ User-Agent    │ curl/8.5.0                                                  │
 ├───┼───────────────┼─────────────────────────────────────────────────────────────┤
 │ 2 │ Accept        │ */*                                                         │
 ├───┼───────────────┼─────────────────────────────────────────────────────────────┤
 │ 3 │ Authorization │ Bearer                                                      │
 │   │               │ eyJraWQiOiJkZWZhdWx0IiwidHlwIjoiSldUIiwiYWxnIjoiUlMyNTYifQ. │
 │   │               │ ..                                                          │
 └───┴───────────────┴─────────────────────────────────────────────────────────────┘
How I got there (wrapper chain)
The request object at DispatcherServlet.doDispatch frame 15 goes through 5 nested .request fields:
SecurityContextHolderAwareRequestWrapper
  → HeaderWriterFilter$HeaderWriterRequest
    → (firewall wrapper)
      → RequestFacade
        → Request
          → coyoteRequest.headers  (MimeHeaders, count=4)
            → headers[0..3]        (MimeHeaderField with nameB/valueB MessageBytes)
No code changes, no rebuilds, no restart. Just the debugger, the agent, and a tmux
Advanced debugging: chasing the SQL
Sometimes you need to dig deeper. I wanted to see the exact SQL that Spring Data JDBC sends, straight from the PostgreSQL wire. I started at the high level (LedgerController.getAllLedgers) and worked down through the stack, trying breakpoints until the right one stuck:
┌──────────────────────────────────────────────────────┬────────────────────────────────────────────────────────────────────────────────────┬────────┐
│ Layer                                                │ Breakpoint tried                                                                   │ Result │
├──────────────────────────────────────────────────────┼────────────────────────────────────────────────────────────────────────────────────┼────────┤
│ java.sql.Connection.prepareStatement(String)         │ Failed — Connection is an interface, jdb can't break on interfaces                 │        │
├──────────────────────────────────────────────────────┼────────────────────────────────────────────────────────────────────────────────────┼────────┤
│ org.postgresql.jdbc.PgConnection.prepareStatement    │ Never hit — HikariCP proxies the connection                                        │        │
├──────────────────────────────────────────────────────┼────────────────────────────────────────────────────────────────────────────────────┼────────┤
│ com.zaxxer.hikari.pool.ProxyPreparedStatement.<init> │ ✅ Hit — the Hikari wrapper constructor receives the real statement as an argument │        │
└──────────────────────────────────────────────────────┴────────────────────────────────────────────────────────────────────────────────────┴────────┘
The key breakpoint
stop in com.zaxxer.hikari.pool.ProxyPreparedStatement.<init>This fires every time HikariCP creates a prepared statement. The constructor signature accepts a statement parameter, the real PgPreparedStatement from the PostgreSQL driver.
Extract the SQL from the driver internals
At the breakpoint, the statement variable is a PgPreparedStatement which has a preparedQuery field of type CachedQuery:
print statement.preparedQuery
→ CachedQuery{executeCount=10, query=SELECT "ledger_ledgers"."id" AS "id", ... LIMIT 20, isFunction=false}
The CachedQuery.toString() conveniently includes the full SQL string.
Sending commands to a tmux pane
Since jdb ran interactively in a tmux pane, I used:
tmux send-keys -t 3 'print statement.preparedQuery' EnterSummary of the chain
curl → Tomcat → Spring MVC → LedgerController.getAllLedgers()
  → LedgerService → PagingAndSortingRepository.findAll(Pageable)
    → Spring Data JDBC → JdbcTemplate
      → HikariCP → ProxyPreparedStatement.<init>(conn, PgPreparedStatement)
                                                   ↑
                                         statement.preparedQuery = the SQL
Final Response
This is what it looks like the final response:
Note
SQL Queries Executed for
GET /api/v1/ledgersFrom the
ProxyPreparedStatement.<init>breakpoint onPgPreparedStatement:Query 1: COUNT (for pagination metadata)
SELECT COUNT(*) FROM "ledger_ledgers"(Earlier runs captured this: Spring Data JDBC executes the count first to populate
PageImpl.totalElements)Query 2: SELECT data (with LIMIT)
SELECT "ledger_ledgers"."id" AS "id",
       "ledger_ledgers"."name" AS "name",
       "ledger_ledgers"."created_at" AS "created_at"
FROM "ledger_ledgers"
LIMIT 20
Conclusion
Agentic debugging is powerful. You get deep insights into your Java system’s state in seconds, entirely hands-off. The days of manually hitting F10 to step through line by line are behind us.
jdb is just for Java, the same pattern applies to gdb for C/C++, pdb for Python, dlv for Go, or any debugger that exposes a command interface. If you can use in a terminal, the agent can use it.
So, do you still prefer hitting F9, F10, F11 to step through your code?